Applied Candidates
Use the metrics available in the Applied Candidates report to dissect your best candidate sources and see where you might want to increase focus on advertising for future great hires.
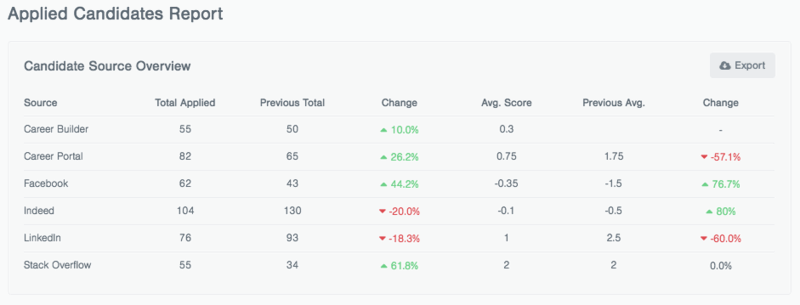
Candidate Source Overview
Here you will see a breakdown of each candidate source, the quality of the candidates coming from that source (assuming you are using scorecards), and both volume and quality comparisons for the time period(s) you choose.
The columns in this report show you the Total Applied candidates, the Previous Total (from the time frame you have selected), and the change from the Previous to the current time frame one; next, you can see the Average Score per candidate, the previous Score, and the percentage Change in Candidate Scores from the previous time frame to the current one.
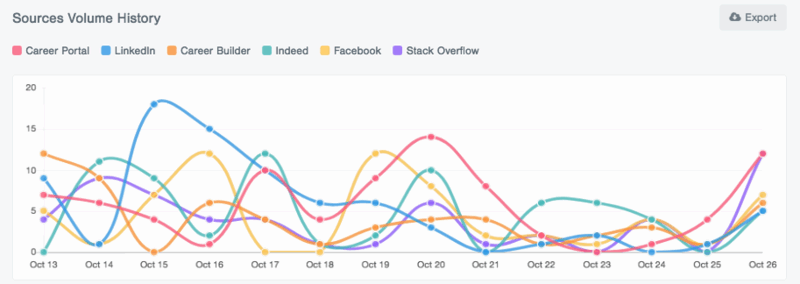
Sources Volume History
Whether you are using free job boards or premium job boards, knowing the kind of candidate volume you have received in the past (broken down by source) helps you plan for future hires.
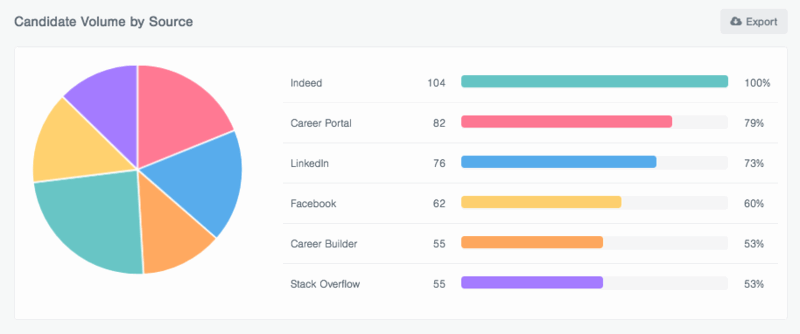
Candidate Volume by Source
What percentage of your candidates come from a given source? Find out fast with a simple visual representation of how each source performs from a comparative volume perspective in this report.
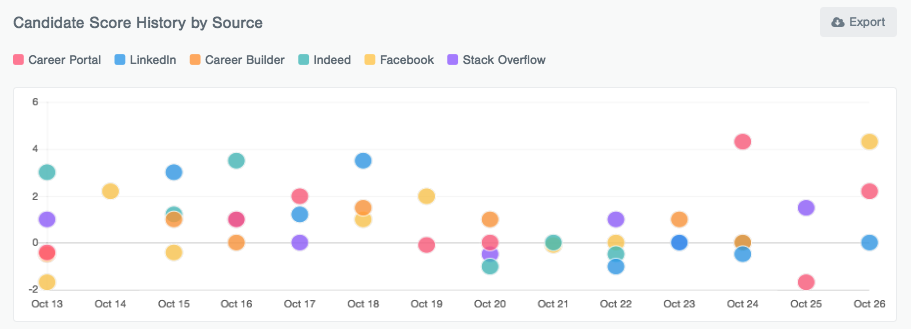
Candidate Score History by Source
How well was a certain job performing at this time last year? Are you getting great quality candidates in June, but not in October? What were you doing differently?
Understanding the quality of your candidates (determined by the scorecards submitted), filtering by source and plotting these on a timeline shows you what promotions were the most valuable in the past, and can help your plan for future promotions, as well.
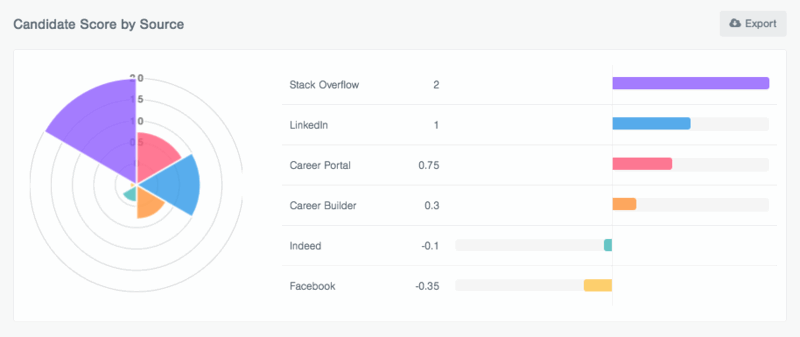
Candidate Score by Source
Using scorecards data, PeopleFluent Recruiting shows you where you are sourcing the hires that your team loves best. Use this report in conjunction with the more volume-focused reporting in the Sources Volume History to get a clearer picture of your hiring funnel's effectiveness.