Open Positions Report
We know it's hard to stay on top of every open position in your organization – how many candidates do you have at each stage, which roles are close to filled, and who's running an efficient process. The Open Positions reporting is designed to be scannable, so you know, at a glance, where you stand and who you need to follow up with.
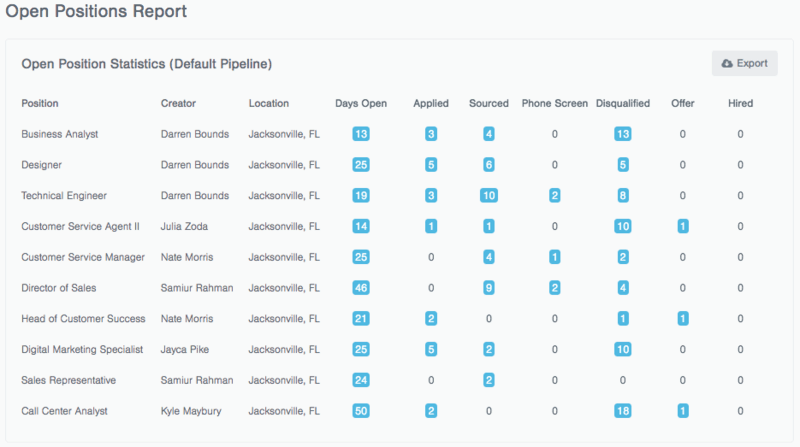
Open Position Statistics (PIPELINE NAME)
This report shows you the most pertinent stats on each open position, presented in table form. Here, you will see: Who created the position, its location, total days the position has been open, and the number of candidates at each stage of the pipeline.
Up in the right-hand corner of the report, you will also have the option to export these details to a .csv.
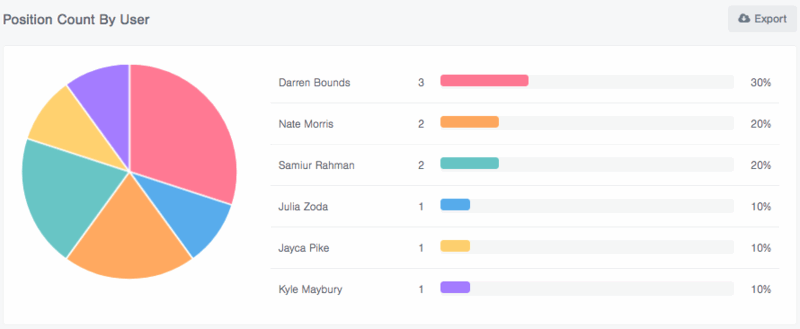
Position Count By User chart
Here, we will compare who in your organization is creating the positions that are currently open by volume. You will be able to scan this report quickly with some handy visual references in the pie chart and bars, as well as note the percentage of open positions each person has created.
Average Days Open By User
This report tells you the average number of days that a position has been open by each position creator – in the example below, we can see Kyle's positions have been open for much longer than anyone else's.
What's going on? Checking back through the other reports on this page, we know he's got only one open position (Call Center Analyst), and he's currently got an offer out to a candidate for that role. After they have accepted, this would be a great role and process to analyze in the Pipeline Performance report to get a better idea of what may have caused the slowdown.